JVM Heap Size and Garbage Collection
You might encounter the following errors when you run out of hip space
Garbage collection is the JVM's process of freeing up unused Java objects in the Java heap. The Java heap is where the objects of a Java program live. It is a repository for live objects, dead objects, and free memory. When an object can no longer be reached from any pointer in the running program, it is considered "garbage" and ready for collection.java.lang.OutOfMemoryError <<no stack trace available>>java.lang.OutOfMemoryError <<no stack trace available>>Exception in thread "main"
The JVM heap size determines how often and how long the VM spends collecting garbage. An acceptable rate for garbage collection is application-specific and should be adjusted after analyzing the actual time and frequency of garbage collections. If you set a large heap size, full garbage collection is slower, but it occurs less frequently. If you set your heap size in accordance with your memory needs, full garbage collection is faster, but occurs more frequently.
The goal of tuning your heap size is to minimize the time that your JVM spends doing garbage collection while maximizing the number of clients that WebLogic Server can handle at a given time. To ensure maximum performance during benchmarking, you might set high heap size values to ensure that garbage collection does not occur during the entire run of the benchmark.
Specifying Heap Size Values
You must specify Java heap size values each time you start an instance of WebLogic Server. This can be done either from thejava command line or by modifying the default values in the startup scripts that are provided with the WebLogic distribution for starting WebLogic Server, as explained in Using WebLogic Startup Scripts to Set Heap Size. For example, when you start a WebLogic Server instance from a
java command line, you could specify the HotSpot VM heap size values as follows:$ java -XX:NewSize=128m -XX:MaxNewSize=128m -XX:SurvivorRatio=8 -Xms512m -Xmx512m Or startWebLogic.sh at the top
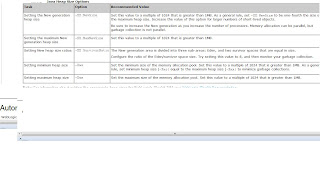
Java Heap Size Options
You achieve best performance by individually tuning each application. However, configuring the Java HotSpot VM heap size options listed in the table below when starting WebLogic Server increases performance for most applications.These options may differ depending on your architecture and operating system. See your vendor's documentation for platform-specific JVM tuning options.
Automatically Logging Low Memory Conditions
WebLogic Server enables you to automatically log low memory conditions observed by the server. WebLogic Server detects low memory by sampling the available free memory a set number of times during a time interval. At the end of each interval, an average of the free memory is recorded and compared to the average obtained at the next interval. If the average drops by a user-configured amount after any sample interval, the server logs a low memory warning message in the log file and sets the server health state to "warning."
If the average free memory ever drops below 5 percent of the initial free memory recorded immediately after you start the server, WebLogic Server logs a message to the log file.
You configure each aspect of the low memory detection process using the Administration Console:
- Click the name of the server instance that you want to configure. Note that you configure low memory detection on a per-server basis.
- Modify the following Memory Option attributes as necessary to tune low memory detection for the selected server instance:
Low Memory GCThreshold: Enter a percentage value (0-99 percent) to represent the threshold after which WebLogic Server logs a low memory warning and changes the health state to "warning." By default,Memory GCThresholdis set to 5 percent. This means that by default the server logs a low memory warning after the average free memory reaches 5 percent of the initial free memory measured at the server's boot time.Low Memory Sample Size: Enter the number of times the server samples free memory during a fixed time period. By default, the server samples free memory 10 times each interval to acquire the average free memory. Using a higher sample size can increase the accuracy of the reading.Low Memory Time Interval: Enter the time, in seconds, that define the interval over which the server determines average free memory values. By default WebLogic Server obtains an average free memory value every 3600 seconds.
Manually Requesting Garbage Collection
Make sure that full garbage collection is necessary before manually selecting it on a server. When you perform garbage collection, the JVM often examines every living object in the heap.To use the Administration Console to request garbage collection on a specific server instance:
- On the Administration Console, expand the server instance node for the server whose memory usage you want to view. A dialog box in the right pane shows the tabs associated with this instance.
'Weblogic' 카테고리의 다른 글
| "Delete Messages From JMS Queue Using WLST: (0) | 2014.09.22 |
|---|---|
| DELETE MESSAGES FROM JMS QUEUE USING WLST (0) | 2014.09.22 |
| weblogic 12c (0) | 2014.08.27 |
| pythons programming (0) | 2014.08.25 |
| JVM Monitoring with WLST (0) | 2014.08.20 |

